Big Tech Weariness Weighs on Stocks; Upcoming 48 Hours May Alter the Situation or Deteriorate It Further.
Written by Emily J. Thompson, Senior Investment Analyst
Updated: Nov 19 2025
0mins
Should l Buy WMT?
Source: Barron's
- Market Performance: U.S. stocks are experiencing their longest losing streak since summer, indicating a significant downturn.
- Investor Concerns: Wall Street is facing its largest pullback from recent highs since last spring, raising concerns among investors.
- Critical Period Ahead: The market is entering a crucial two-day period for investors aiming to safeguard their gains as the year comes to a close.
- Focus on Year-End Gains: Investors are particularly focused on protecting their hard-fought gains as they navigate this challenging market phase.
Trade with 70% Backtested Accuracy
Stop guessing "Should I Buy WMT?" and start using high-conviction signals backed by rigorous historical data.
Sign up today to access powerful investing tools and make smarter, data-driven decisions.
Analyst Views on WMT
Wall Street analysts forecast WMT stock price to fall over the next 12 months. According to Wall Street analysts, the average 1-year price target for WMT is 125.75 USD with a low forecast of 119.00 USD and a high forecast of 136.00 USD. However, analyst price targets are subjective and often lag stock prices, so investors should focus on the objective reasons behind analyst rating changes, which better reflect the company's fundamentals.
26 Analyst Rating
25 Buy
1 Hold
0 Sell
Strong Buy
Current: 126.940
Low
119.00
Averages
125.75
High
136.00
Current: 126.940
Low
119.00
Averages
125.75
High
136.00
About WMT
Walmart Inc. is a technology-powered omnichannel retailer. The Company is engaged in the operation of retail and wholesale stores and clubs, as well as eCommerce Websites and mobile applications, located throughout the United States (U.S.), Africa, Canada, Central America, Chile, China, India and Mexico. It operates in three reportable segments: Walmart U.S., Walmart International and Sam's Club U.S. The Walmart U.S. segment includes the Company's mass merchandising concept in the U.S., as well as eCommerce, which includes omni-channel initiatives and certain other business offerings such as advertising services. The Walmart International segment consists of the Company's operations outside of the U.S. through its subsidiaries, as well as eCommerce and omni-channel initiatives. The Sam's Club U.S. segment includes the warehouse membership clubs in the U.S., as well as samsclub.com and omni-channel initiatives.
About the author

Emily J. Thompson
Emily J. Thompson, a Chartered Financial Analyst (CFA) with 12 years in investment research, graduated with honors from the Wharton School. Specializing in industrial and technology stocks, she provides in-depth analysis for Intellectia’s earnings and market brief reports.
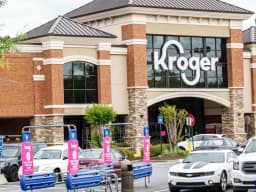
Kroger's CEO Transition Sparks Stock Surge
- Stock Surge: Kroger's shares jumped nearly 3% in pre-market trading on Monday following reports that former Walmart executive Greg Foran is being considered for the CEO position, indicating a positive market reaction to the leadership change.
- Historical Performance: The stock gained over 7% last week, marking its best weekly performance since June 2025, and is up about 8% year-to-date, on track for a ninth consecutive year of gains if this momentum continues.
- Management Transition: Kroger announced last year that CEO Rodney McMullen resigned due to personal conduct issues, leading the board to appoint Ronald Sargent as chairman and interim CEO, reflecting adjustments in the company's governance structure.
- Market Sentiment Shift: According to Stocktwits data, retail sentiment on Kroger has shifted from 'Neutral' a month ago to 'Bearish', indicating a decline in investor confidence regarding the company's future, despite a 3% increase in stock price over the past 12 months.
See More
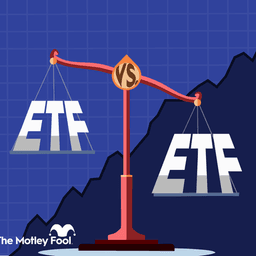
Comparison of FSTA and RSPS Consumer Staples ETFs
- Cost Comparison: FSTA's expense ratio is just 0.08%, significantly lower than RSPS's 0.40%, meaning investors pay only $8 annually for every $10,000 invested in FSTA compared to $40 for RSPS, greatly reducing investment costs.
- Performance Metrics: As of February 3, 2026, FSTA boasts a 1-year return of 8.34%, surpassing RSPS's 7.01%, indicating that FSTA has provided higher returns over the past year, potentially attracting yield-seeking investors.
- Risk Assessment: Over the past five years, FSTA's maximum drawdown stands at 16.57%, lower than RSPS's 18.61%, showcasing FSTA's relative stability during market fluctuations, which may appeal to risk-averse investors.
- Holding Structure: FSTA holds 96 stocks primarily focused on consumer defensive names, while RSPS equally weights 36 stocks, leading to a strategy where FSTA may achieve higher returns when top companies perform well but also faces greater volatility risk.
See More

Comparison Analysis of FSTA and RSPS ETFs
- Expense Ratio Advantage: FSTA boasts a significantly lower expense ratio of 0.08% compared to RSPS's 0.40%, meaning investors pay only $8 annually for every $10,000 invested in FSTA versus $40 for RSPS, enhancing FSTA's cost-effectiveness for long-term investors.
- Return Performance Discrepancy: While RSPS offers a slightly higher dividend yield, FSTA has outperformed in one-year and five-year total returns, indicating that FSTA may provide better capital appreciation opportunities amid market fluctuations.
- Holdings Structure Comparison: FSTA holds 96 stocks, primarily concentrated in large consumer brands like Costco, Walmart, and Procter & Gamble, which account for nearly 37% of its assets, whereas RSPS evenly distributes its 36 holdings, ensuring a balanced risk and return profile.
- Investment Strategy Choice: FSTA's concentrated holdings strategy may yield excess returns when large brands perform well, but it also poses greater risks during market downturns, while RSPS's equal-weight strategy helps mitigate single-stock volatility, making it suitable for risk-averse investors.
See More

Investor Confusion in AI Competition
- Investor Sentiment Shift: Following earnings calls from tech giants like Microsoft, Google, and Amazon, investor confusion about future directions led to Amazon losing over $300 billion in market cap, reflecting strong skepticism regarding its $200 billion AI investment plan.
- Capital Expenditure Comparison: Google announced an increase in capital expenditures to $175 billion to $185 billion, exceeding the expected $115 billion to $120 billion, indicating a proactive approach in AI despite challenges from slowing ad revenues.
- Changing Competitive Landscape: With Alphabet's ongoing investments and successes in AI, YouTube's user base has grown to 750 million, and Waymo's self-driving business is outpacing Tesla, suggesting a strengthening competitive advantage that may attract more investor interest.
- Mixed Market Reactions: Despite OpenAI and Anthropic's strong performance in AI, Microsoft's Copilot sales have been disappointing, highlighting investor concerns about its future growth and reflecting differing levels of confidence across companies.
See More

e.l.f. Beauty Surprises with Q3 Results, Stock Reversal Presents Buying Opportunity
- Significant Sales Growth: e.l.f. Beauty reported a 38% year-over-year sales increase in Q3 2023, reaching $489.5 million, significantly exceeding the analyst consensus of $460 million, indicating robust market demand and brand appeal.
- Enhanced Profitability: Adjusted earnings per share (EPS) surged 68% from $0.74 to $1.24, surpassing the analyst expectation of $0.72, reflecting the company's success in cost control and operational efficiency.
- Market Share Expansion: The e.l.f. brand gained 130 basis points in the mass cosmetics market, with U.S. and international revenues rising 36% and 44% respectively, despite weak consumption in the U.K., showcasing the brand's global appeal.
- Optimistic Outlook: The company raised its fiscal 2026 sales guidance to a growth range of 22% to 33%, expecting Rhode to contribute $260 million to $265 million in revenue, demonstrating confidence in future growth and strategic positioning.
See More

e.l.f. Beauty Reports Strong Q3 Results Exceeding Expectations
- Significant Sales Growth: e.l.f. Beauty's Q3 sales soared 38% year-over-year to $489.5 million, easily surpassing the analyst consensus of $460 million, indicating strong market demand and brand appeal.
- Improved Profitability: Adjusted earnings per share (EPS) surged 68% from $0.74 to $1.24, exceeding the analyst estimate of $0.72, reflecting the company's success in cost control and operational efficiency.
- Rhode Brand Contribution: The Rhode brand contributed $128 million in revenue during the quarter, bolstered by its successful launch at Sephora, further solidifying e.l.f.'s position in the rapidly growing beauty market.
- Optimistic Outlook: e.l.f. raised its fiscal 2026 sales guidance to an increase of 22% to 33%, with Rhode expected to contribute $260 million to $265 million in revenue, demonstrating the company's confidence in future growth and strategic positioning.
See More
Kroger's CEO Transition Sparks Stock Surge
- Stock Surge: Kroger's shares jumped nearly 3% in pre-market trading on Monday following reports that former Walmart executive Greg Foran is being considered for the CEO position, indicating a positive market reaction to the leadership change.
- Historical Performance: The stock gained over 7% last week, marking its best weekly performance since June 2025, and is up about 8% year-to-date, on track for a ninth consecutive year of gains if this momentum continues.
- Management Transition: Kroger announced last year that CEO Rodney McMullen resigned due to personal conduct issues, leading the board to appoint Ronald Sargent as chairman and interim CEO, reflecting adjustments in the company's governance structure.
- Market Sentiment Shift: According to Stocktwits data, retail sentiment on Kroger has shifted from 'Neutral' a month ago to 'Bearish', indicating a decline in investor confidence regarding the company's future, despite a 3% increase in stock price over the past 12 months.
See More
Comparison of FSTA and RSPS Consumer Staples ETFs
- Cost Comparison: FSTA's expense ratio is just 0.08%, significantly lower than RSPS's 0.40%, meaning investors pay only $8 annually for every $10,000 invested in FSTA compared to $40 for RSPS, greatly reducing investment costs.
- Performance Metrics: As of February 3, 2026, FSTA boasts a 1-year return of 8.34%, surpassing RSPS's 7.01%, indicating that FSTA has provided higher returns over the past year, potentially attracting yield-seeking investors.
- Risk Assessment: Over the past five years, FSTA's maximum drawdown stands at 16.57%, lower than RSPS's 18.61%, showcasing FSTA's relative stability during market fluctuations, which may appeal to risk-averse investors.
- Holding Structure: FSTA holds 96 stocks primarily focused on consumer defensive names, while RSPS equally weights 36 stocks, leading to a strategy where FSTA may achieve higher returns when top companies perform well but also faces greater volatility risk.
See More
Comparison Analysis of FSTA and RSPS ETFs
- Expense Ratio Advantage: FSTA boasts a significantly lower expense ratio of 0.08% compared to RSPS's 0.40%, meaning investors pay only $8 annually for every $10,000 invested in FSTA versus $40 for RSPS, enhancing FSTA's cost-effectiveness for long-term investors.
- Return Performance Discrepancy: While RSPS offers a slightly higher dividend yield, FSTA has outperformed in one-year and five-year total returns, indicating that FSTA may provide better capital appreciation opportunities amid market fluctuations.
- Holdings Structure Comparison: FSTA holds 96 stocks, primarily concentrated in large consumer brands like Costco, Walmart, and Procter & Gamble, which account for nearly 37% of its assets, whereas RSPS evenly distributes its 36 holdings, ensuring a balanced risk and return profile.
- Investment Strategy Choice: FSTA's concentrated holdings strategy may yield excess returns when large brands perform well, but it also poses greater risks during market downturns, while RSPS's equal-weight strategy helps mitigate single-stock volatility, making it suitable for risk-averse investors.
See More
Investor Confusion in AI Competition
- Investor Sentiment Shift: Following earnings calls from tech giants like Microsoft, Google, and Amazon, investor confusion about future directions led to Amazon losing over $300 billion in market cap, reflecting strong skepticism regarding its $200 billion AI investment plan.
- Capital Expenditure Comparison: Google announced an increase in capital expenditures to $175 billion to $185 billion, exceeding the expected $115 billion to $120 billion, indicating a proactive approach in AI despite challenges from slowing ad revenues.
- Changing Competitive Landscape: With Alphabet's ongoing investments and successes in AI, YouTube's user base has grown to 750 million, and Waymo's self-driving business is outpacing Tesla, suggesting a strengthening competitive advantage that may attract more investor interest.
- Mixed Market Reactions: Despite OpenAI and Anthropic's strong performance in AI, Microsoft's Copilot sales have been disappointing, highlighting investor concerns about its future growth and reflecting differing levels of confidence across companies.
See More
e.l.f. Beauty Surprises with Q3 Results, Stock Reversal Presents Buying Opportunity
- Significant Sales Growth: e.l.f. Beauty reported a 38% year-over-year sales increase in Q3 2023, reaching $489.5 million, significantly exceeding the analyst consensus of $460 million, indicating robust market demand and brand appeal.
- Enhanced Profitability: Adjusted earnings per share (EPS) surged 68% from $0.74 to $1.24, surpassing the analyst expectation of $0.72, reflecting the company's success in cost control and operational efficiency.
- Market Share Expansion: The e.l.f. brand gained 130 basis points in the mass cosmetics market, with U.S. and international revenues rising 36% and 44% respectively, despite weak consumption in the U.K., showcasing the brand's global appeal.
- Optimistic Outlook: The company raised its fiscal 2026 sales guidance to a growth range of 22% to 33%, expecting Rhode to contribute $260 million to $265 million in revenue, demonstrating confidence in future growth and strategic positioning.
See More
e.l.f. Beauty Reports Strong Q3 Results Exceeding Expectations
- Significant Sales Growth: e.l.f. Beauty's Q3 sales soared 38% year-over-year to $489.5 million, easily surpassing the analyst consensus of $460 million, indicating strong market demand and brand appeal.
- Improved Profitability: Adjusted earnings per share (EPS) surged 68% from $0.74 to $1.24, exceeding the analyst estimate of $0.72, reflecting the company's success in cost control and operational efficiency.
- Rhode Brand Contribution: The Rhode brand contributed $128 million in revenue during the quarter, bolstered by its successful launch at Sephora, further solidifying e.l.f.'s position in the rapidly growing beauty market.
- Optimistic Outlook: e.l.f. raised its fiscal 2026 sales guidance to an increase of 22% to 33%, with Rhode expected to contribute $260 million to $265 million in revenue, demonstrating the company's confidence in future growth and strategic positioning.
See More


