Ethereum Whales Accumulate 220,000 Tokens in a Week, Totaling $660 Million


- Whale Accumulation Trend: Over the past week, wallets holding between 10,000 and 100,000 Ethereum tokens accumulated approximately 220,000 tokens, totaling around $660 million, indicating strong confidence from large holders as retail traders reduced their positions.
- Supply-Demand Shift: Despite Ethereum trading near $2,930, the whale accumulation occurred during a period of price weakness, suggesting that funds and high-net-worth participants are positioning for the long term rather than engaging in short-term trades.
- Exchange Outflow Pressure: The outflows from Ethereum spot ETFs have intensified selling pressure in the market; however, the buying behavior of whales contrasts sharply with retail traders' hesitation, potentially leading to a divergence in market forces.
- Increased Leverage Usage: According to Hyblock Capital, about 70% of global net Ethereum positions on Binance have been long over the past 30 days, with the Estimated Leverage Ratio reaching an all-time high of 0.611, indicating that traders are increasing leverage while the available supply of Ethereum for sale decreases, which could support prices if demand rises.
Get Real-Time Alerts for Any Crypto Movement
Technical Analysis for ETH
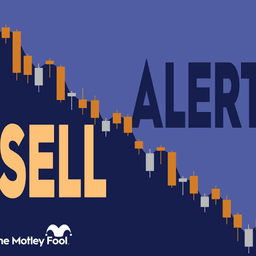
Technical Sentiment Analysis for Ethereum (ETH) As of , Ethereum (ETH) is exhibiting a Sell technical sentiment. Our proprietary analysis, which aggregates 3 technical signals, shows that 0 indicators are flashing buy, while 3 are indicating sell.
Momentum Indicators: RSI, MACD & Overbought/Oversold Status Currently, the Relative Strength Index (RSI) for ETH stands at -, which suggests a Neutral condition. Meanwhile, the MACD (12, 26) indicator is at -, providing a Neutral signal for short-term momentum. Other oscillators like the Stochastic Oscillator at - and the Commodity Channel Index (CCI) at - further confirm a - outlook for the stock.
Support, Resistance & Moving Averages From a structural perspective, ETH is trading below its 60-day moving average of $- and below its 200-day long-term moving average of $-. Key price levels to watch include the immediate resistance at $- and strong support at $-. A break above $- could signal a bull continuation, while falling below $- may test the next Fibonacci floor at $-.
Ethereum (ETH) Support & Resistance Level
| Name | S3 | S2 | S1 | Pivot Points | R1 | R2 | R3 |
|---|---|---|---|---|---|---|---|
| Classic | 734.491 | 1241.146 | 1701.331 | 2207.986 | 2668.171 | 3174.826 | 3635.011 |
| Fibonacci | 1241.146 | 1610.479 | 1838.653 | 2207.986 | 2577.319 | 2805.493 | 3174.826 |
About ETH
About the author