Bitcoin Price Forecast: Andrew Tate Anticipates BTC Drop to $26K, Yet This Altcoin May Surge 50x by 2026


Bitcoin Market Sentiment: Bitcoin (BTC) is currently priced at $106,852, showing a 1.75% increase in the last 24 hours, but trading volume has decreased by 33.61%. Investors are cautious due to macroeconomic uncertainties and are exploring smaller-cap assets with real-world use cases.
Remittix (RTX) Growth: Remittix, a DeFi project focused on crypto-to-bank transfers in over 30 countries, has raised over $27.5 million and sold more than 679 million tokens. It has achieved CertiK verification, indicating strong security, and is set to list on BitMart and LBank.
Investor Shift to Utility Projects: As concerns about Bitcoin's short-term performance grow, investors are increasingly interested in projects like Remittix that offer tangible utility and scalability, positioning it as a strong candidate for long-term growth in the crypto market.
User Engagement and Incentives: Remittix has launched a beta wallet, a 15% referral program, and a $250,000 giveaway to boost community engagement, alongside a limited-time 50% token bonus, enhancing its appeal as a low gas fee crypto project with real adoption potential.
Get Real-Time Alerts for Any Crypto Movement
Technical Analysis for ALT
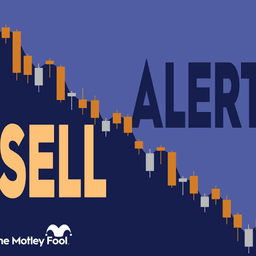
Technical Sentiment Analysis for Altlayer (ALT) As of , Altlayer (ALT) is exhibiting a Sell technical sentiment. Our proprietary analysis, which aggregates 4 technical signals, shows that 1 indicators are flashing buy, while 3 are indicating sell.
Momentum Indicators: RSI, MACD & Overbought/Oversold Status Currently, the Relative Strength Index (RSI) for ALT stands at -, which suggests a Neutral condition. Meanwhile, the MACD (12, 26) indicator is at -, providing a Neutral signal for short-term momentum. Other oscillators like the Stochastic Oscillator at - and the Commodity Channel Index (CCI) at - further confirm a - outlook for the stock.
Support, Resistance & Moving Averages From a structural perspective, ALT is trading below its 60-day moving average of $- and below its 200-day long-term moving average of $-. Key price levels to watch include the immediate resistance at $- and strong support at $-. A break above $- could signal a bull continuation, while falling below $- may test the next Fibonacci floor at $-.
Altlayer (ALT) Support & Resistance Level
| Name | S3 | S2 | S1 | Pivot Points | R1 | R2 | R3 |
|---|---|---|---|---|---|---|---|
| Classic | 0.00306 | 0.00498 | 0.00691 | 0.00883 | 0.0108 | 0.0127 | 0.0146 |
| Fibonacci | 0.00498 | 0.00645 | 0.00736 | 0.00883 | 0.0103 | 0.0112 | 0.0127 |
About ALT
About the author